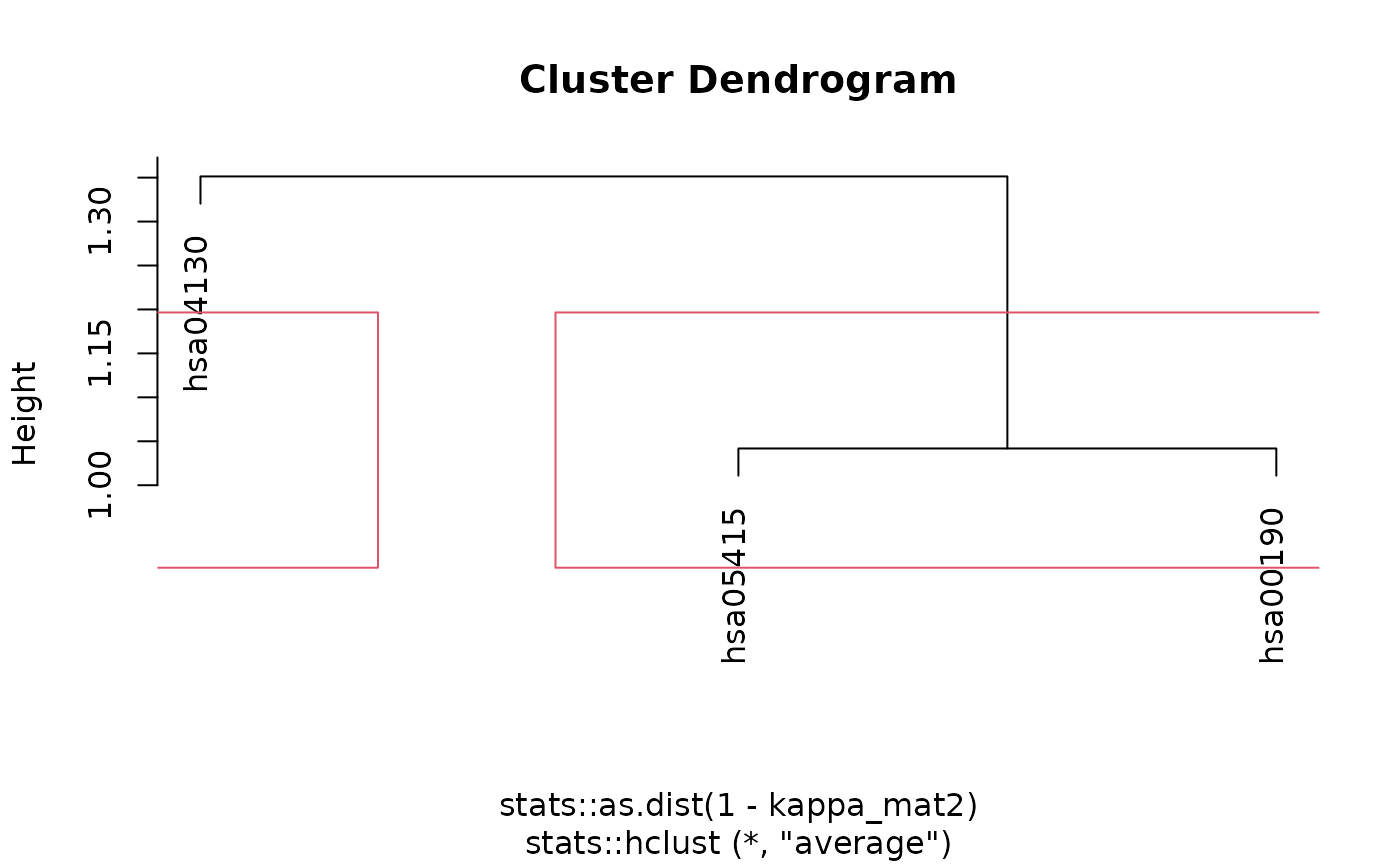
Cluster Enriched Terms
cluster_enriched_terms(
  enrichment_res,
  method = "hierarchical",
  plot_clusters_graph = TRUE,
  use_description = FALSE,
  use_active_snw_genes = FALSE,
  ...
)
Arguments
- enrichment_res
data frame of pathfindR enrichment results. Must-have columns are 'Term_Description' (if
use_description = TRUE) or 'ID' (ifuse_description = FALSE), 'Down_regulated', and 'Up_regulated'. Ifuse_active_snw_genes = TRUE, 'non_Signif_Snw_Genes' must also be provided.- method
Either 'hierarchical' or 'fuzzy'. Details of clustering are provided in the corresponding functions
hierarchical_term_clustering, andfuzzy_term_clustering- plot_clusters_graph
boolean value indicate whether or not to plot the graph diagram of clustering results (default = TRUE)
- use_description
Boolean argument to indicate whether term descriptions (in the 'Term_Description' column) should be used. (default =
FALSE)- use_active_snw_genes
boolean to indicate whether or not to use non-input active subnetwork genes in the calculation of kappa statistics (default = FALSE, i.e. only use affected genes)
- ...
additional arguments for
hierarchical_term_clustering,fuzzy_term_clusteringandcluster_graph_vis. See documentation of these functions for more details.
Value
a data frame of clustering results. For 'hierarchical', the cluster assignments (Cluster) and whether the term is representative of its cluster (Status) is added as columns. For 'fuzzy', terms that are in multiple clusters are provided for each cluster. The cluster assignments (Cluster) and whether the term is representative of its cluster (Status) is added as columns.
See also
See hierarchical_term_clustering for hierarchical
clustering of enriched terms.
See fuzzy_term_clustering for fuzzy clustering of enriched terms.
See cluster_graph_vis for graph visualization of clustering.
Examples
example_clustered <- cluster_enriched_terms(
  example_pathfindR_output[1:3, ],
  plot_clusters_graph = FALSE
)
#> The maximum average silhouette width was 0.1 for k = 2
#>

example_clustered <- cluster_enriched_terms(
  example_pathfindR_output[1:3, ],
  method = "fuzzy", plot_clusters_graph = FALSE
)
example_clustered <- cluster_enriched_terms(
example_pathfindR_output[1:3, ],
method = "fuzzy", plot_clusters_graph = FALSE
)